Many people are starting to use Microsoft Copilot in Excel, but the first question is usually:
What should I actually ask it to do?
In this example, we’ll start with messy data and use Copilot to clean and analyse it step-by-step.
Step 1: Copy and Paste the Data into Excel
Copy the data and paste it into Excel.
When pasted, you may notice that all the data appears in a single column.
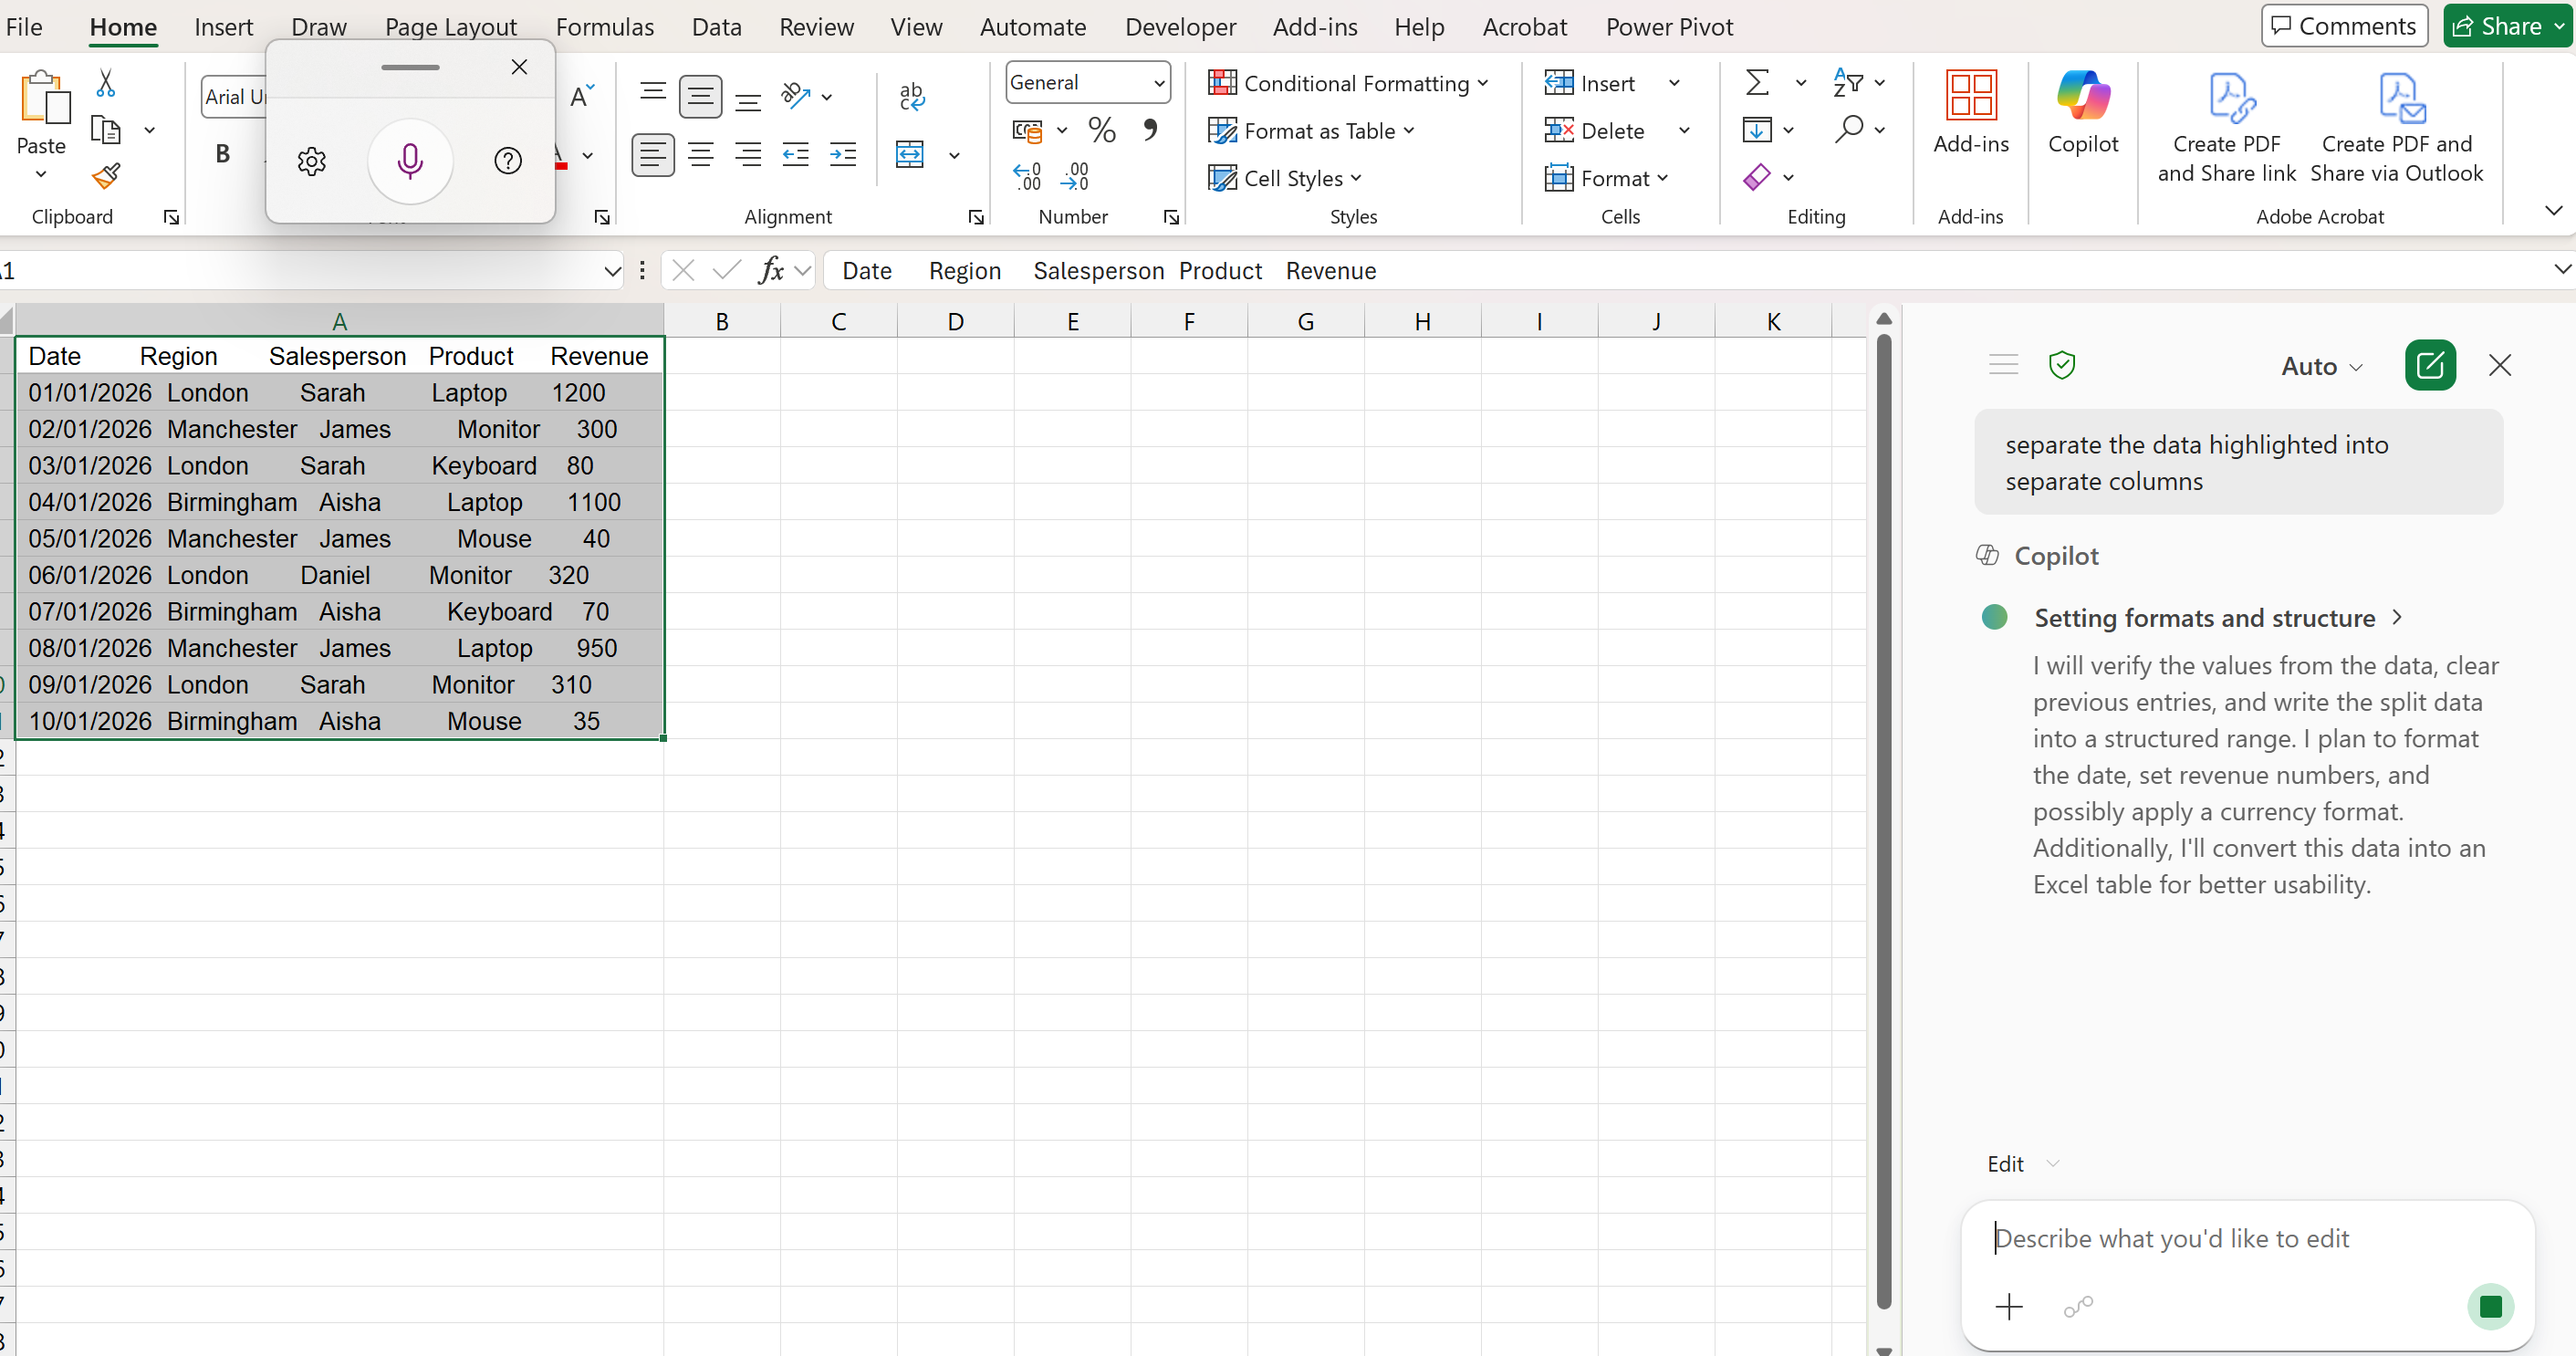
Example: Data pasted into a single column
Step 2: Ask Copilot to Separate the Data
Instead of using Text to Columns manually, we can ask Copilot to do this for us.
Open Copilot and type the following prompt:
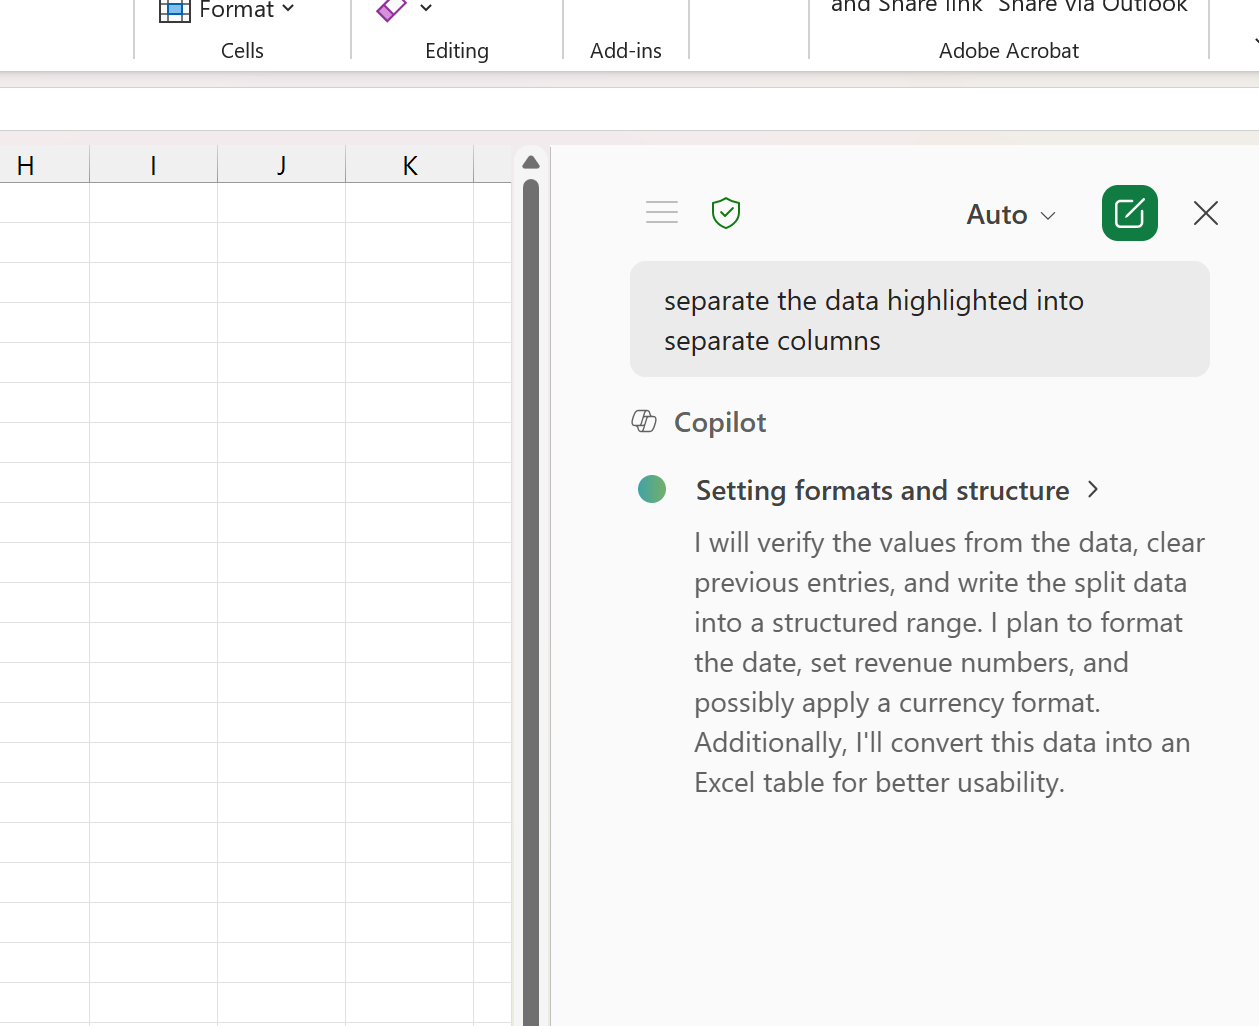
Example: Copilot prompt used to split data into columns
Copilot will recognise the structure and split the data into the correct columns.
Step 3: Review the Result
After Copilot processes the request, your data should now be neatly arranged into columns such as:
- Date
- Region
- Salesperson
- Product
- Revenue
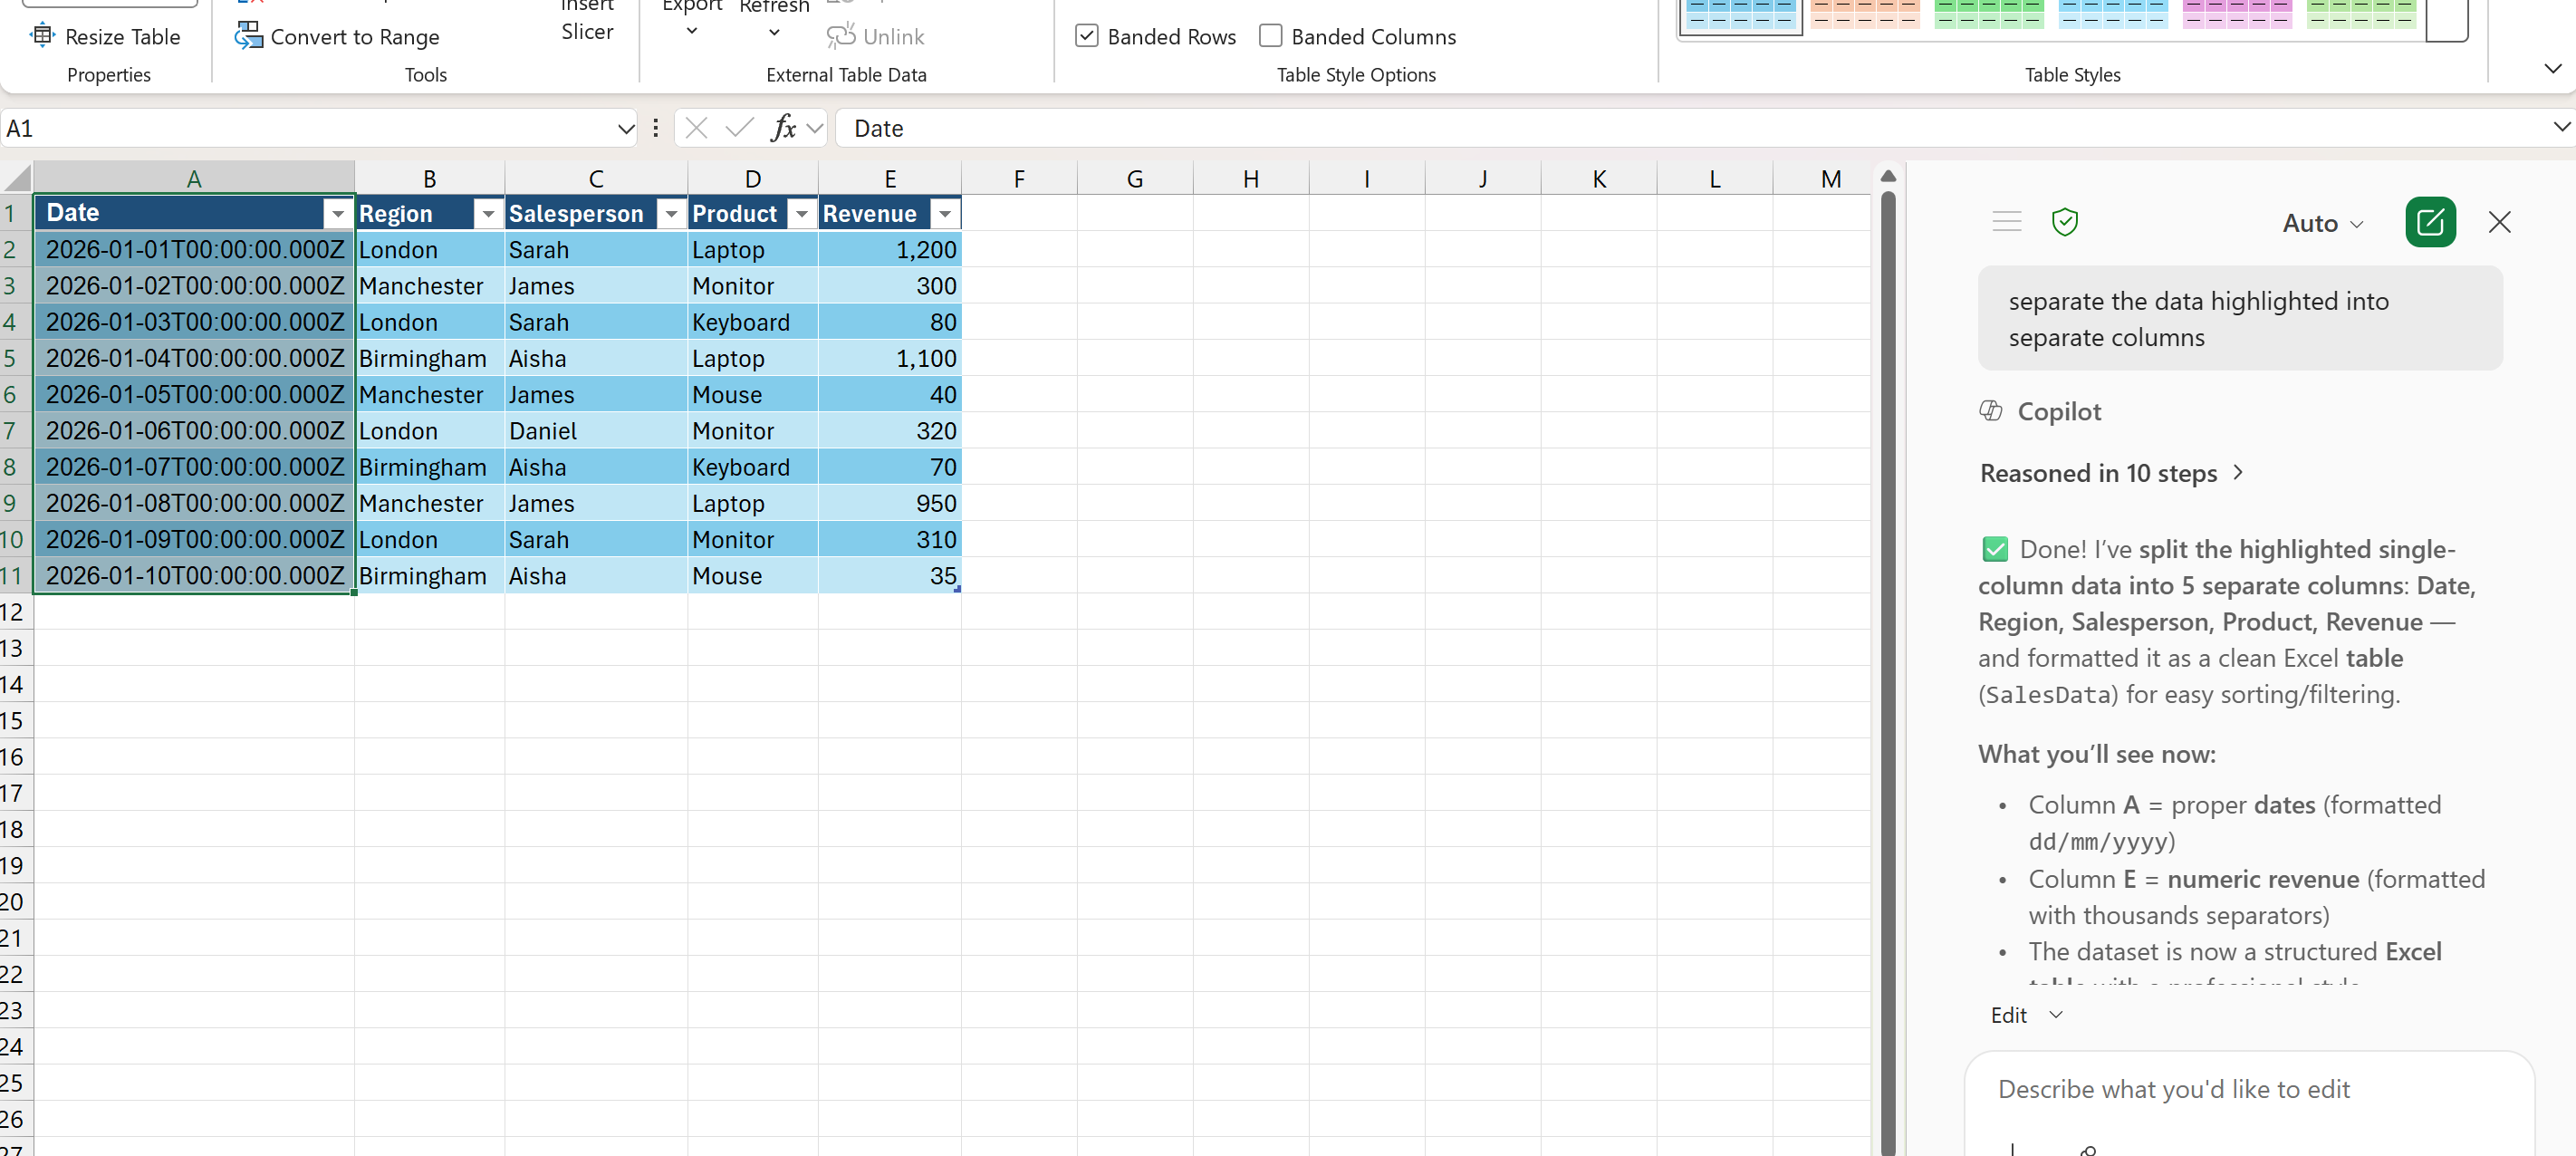
Example: Data correctly split into columns using Copilot
Step 4: Convert the Data into a Table
Now that the data is structured correctly:
- Select the data
- Press Ctrl + T to turn it into a table
Step 5: Start Asking Questions
Now your data is clean, Copilot becomes much more powerful.
Try asking:
Taking the Next Step
If you’d like to practise these kinds of real-world tasks with guidance, we run 90-minute Microsoft Copilot training sessions focused on practical Excel, Word, PowerPoint and wider Microsoft 365 scenarios.